
X-Factors: Triple-A ballpark effects
In X-Factors, MiLB.com's Ashley Marshall offers a class-by-class examination of how Minor League venues affect the play on the field. Have something to say about how your favorite Minor League park plays? Tweet @MiLB and @AshMarshallMLB with your thoughts.
When it comes to the Minor Leagues, Triple-A is the closest a player can get to The Show.
Though some of the game's top prospects might skip a level or two further down the chain, Triple-A baseball is arguably the toughest test for a player looking to make a final good impression.
It's here where the level of competition is closest to that of the Majors. Veterans and hypothetical "Quad-A" players are trying to make their way back to the big leagues and prospects are getting one last bit of seasoning with the knowledge that the next phone call they receive could make their careers.
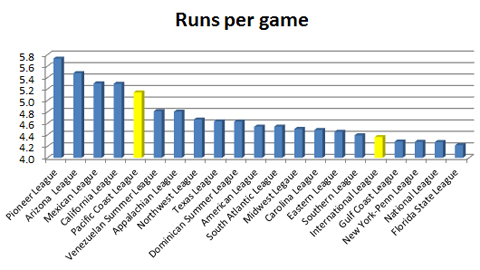
Within the two domestic Triple-A leagues, however, two different environments exist. The predominantly East Coast-based International League is considered much tougher for hitters than its counterpart, the geographically diverse Pacific Coast League, where offensive numbers are consistently among the highest in the Minors.
The environment in the International League is similar to that of both the American and National Leagues in terms of runs per game, batting average and on-base percentage. PCL games, on the other hand, average more than half a run more per game due to higher batting averages and greater home run rates, in spite of some teams' decisions to fight the dry air and high elevations with Coors Field-esque humidors. Fielding percentages are the highest in the Minors but marginally lower than in the Majors, suggesting that the extra runs are created more by hitting than by miscues and errors.
That's why context is important when comparing players and predicting future performance.
Offensive stats by league, 2008-2013
| League | Class | R/G | AVG | OBP | SLG | OPS | HR% | BB% | FLD% |
|---|---|---|---|---|---|---|---|---|---|
| American | Majors | 4.5 | .260 | .327 | .413 | .740 | 2.7 | 8.3 | .984 |
| National | Majors | 4.3 | .255 | .323 | .400 | .723 | 2.4 | 8.4 | .984 |
| International | Triple-A | 4.4 | .260 | .329 | .397 | .726 | 2.1 | 8.6 | .979 |
| Mexican | Triple-A | 5.3 | .295 | .365 | .435 | .800 | 2.3 | 9.0 | .977 |
| Pacific Coast | Triple-A | 5.1 | .277 | .347 | .431 | .778 | 2.5 | 9.0 | .978 |
| Eastern | Double-A | 4.5 | .259 | .332 | .393 | .725 | 2.0 | 8.8 | .976 |
| Southern | Double-A | 4.4 | .257 | .334 | .385 | .719 | 1.8 | 9.4 | .975 |
| Texas | Double-A | 4.6 | .262 | .334 | .396 | .730 | 2.1 | 8.7 | .975 |
| California | Class A Adv | 5.3 | .272 | .342 | .422 | .764 | 2.3 | 8.6 | .971 |
| Carolina | Class A Adv | 4.5 | .256 | .329 | .386 | .714 | 1.8 | 8.6 | .972 |
| Florida State | Class A Adv | 4.2 | .256 | .326 | .372 | .698 | 1.5 | 8.4 | .973 |
| Midwest | Class A | 4.5 | .254 | .327 | .376 | .703 | 1.6 | 8.7 | .969 |
| South Atlantic | Class A | 4.5 | .256 | .326 | .378 | .704 | 1.6 | 8.3 | .968 |
| New York-Penn | Short Season | 4.3 | .247 | .322 | .353 | .674 | 1.2 | 8.6 | .966 |
| Northwest | Short Season | 4.7 | .253 | .334 | .364 | .699 | 1.4 | 9.3 | .967 |
| Appalachian | Rookie | 4.8 | .256 | .328 | .384 | .712 | 1.7 | 8.2 | .962 |
| Arizona | Rookie | 5.5 | .264 | .341 | .381 | .721 | 1.1 | 9.1 | .955 |
| Gulf Coast | Rookie | 4.3 | .245 | .323 | .345 | .668 | 1.0 | 8.6 | .962 |
| Pioneer | Rookie | 5.7 | .276 | .349 | .421 | .770 | 2.0 | 8.7 | .961 |
| Dominican Summer | Rookie | 4.6 | .238 | .336 | .322 | .658 | 0.7 | 10.7 | .952 |
| Venezuelan Summer | Rookie | 4.8 | .262 | .343 | .366 | .709 | 1.2 | 8.9 | .955 |
Here's an in-depth look at the park factors for each Triple-A stadium since 2010. Where a club has relocated or changed leagues, two parks were listed. The table looks at three statistics -- runs, home runs and hits -- and used the following formula to help compare parks:
((Runs scored at home + runs allowed at home)/(Home games)) / ((Runs scored on the road + runs allowed on the road)/(Road games))
View the entire 2013 park factors list, alphabetized by team »
Note: A park factor of 1.000 is considered neutral and represents an equal number of runs/homers/hits produced in the home team's games there and those on the road. A factor over 1.000 favors hitters, while a factor under 1.000 favors pitchers. A weighted average was added into the calculation to place a greater emphasis on more recent data to be more reflective of the most current makeup of each team and league and to ensure the statistics were not disproportionately skewed by extremes.
International League: At a Glance
| Stadium | Team | R | HR | H |
|---|---|---|---|---|
| Huntington Park | Columbus Clippers | 1.230 | 1.681 | 1.089 |
| Durham Bulls Athletic Park | Durham Bulls | 1.107 | 1.415 | 1.051 |
| Frontier Field | Rochester Red Wings | 1.052 | 1.045 | 1.012 |
| Alliance Bank Stadium | Syracuse Chiefs | 1.028 | 0.972 | 1.029 |
| Louisville Slugger Field | Louisville Bats | 1.027 | 0.965 | 1.015 |
| Coolray Field | Gwinnett Braves | 1.025 | 0.873 | 1.036 |
| Coca-Cola Field | Buffalo Bisons | 1.015 | 0.977 | 0.958 |
| Victory Field | Indianapolis Indians | 0.989 | 0.885 | 1.027 |
| Harbor Park | Norfolk Tides | 0.973 | 0.861 | 0.981 |
| Knights Stadium | Charlotte Knights | 0.969 | 1.068 | 0.991 |
| McCoy Stadium | Pawtucket Red Sox | 0.946 | 1.198 | 0.961 |
| Coca-Cola Park | Lehigh Valley IronPigs | 0.923 | 0.884 | 0.960 |
| Fifth Third Field | Toledo Mud Hens | 0.899 | 0.762 | 0.954 |
| PNC Field (2010-11, 2013) | SWB RailRiders | 0.878 | 0.824 | 0.945 |
The International League has been the more offensively challenged Triple-A circuit for several years. Run rates, batting averages, homer rates and walk rates are all lower in the IL than either the Pacific Coast League or Mexican League.
Only Columbus, Durham and Rochester played home games in ballparks that favor hitters in terms of home run rates and run rates. Of these, the Clippers' Huntington Park is the most hitter-friendly park in the IL, with Durham Bulls Athletic Park a close second.
The most pitcher-friendly parks in most offensive metrics, including hits, runs and homers, are newly renovated PNC Field -- which maintained the same field dimensions -- and Toledo's Fifth Third Field.
Fighting the extremes
Toledo's yard has played big for many years and maintained its reputation as a stingy offensive park in 2013. The Mud Hens and their opponents combined to hit 80 homers at Fifth Third Field, compared with 134 in Toledo's road games. There were 558 runs scored in the 72 games in Toledo, compared with 652 runs in the same number of games on the Mud Hens' travels.
"It's definitely a pitchers' park early in the year when it's cold," said Nick Castellanos, MLB.com's No. 15 prospect. "It's freezing in April and halfway through May. It's pretty difficult to get anything out of anywhere when it's freezing and you're wearing six layers of clothing to stay warm. As the summer goes on, it plays a little more fair, but overall it's more of a pitchers' park."
Castellanos was one of the few Mud Hens to post similar numbers at home and on the road, but he was not immune to the extremes.
"We played in Gwinnett and Durham early in the year and the ball was flying out of there just fine," he said. "Columbus is a hitters' park. In the cold it's tough to hit it out, but in the summer it was my favorite park to play in, for sure.
"Scranton is the most [extreme] pitchers' park I've ever played at in my life. We had a four-game series there and you can crush balls that you think would get over the fence or down in the gap, but outfielders get under them. They said it was because there's a hill right behind the fence and the air will roll down the hill and blow everything in. It is 100 percent a pitchers' park."
Castellanos said extreme environments like that have an effect, both at the plate and in the outfield.
"In Scranton, they want you to hit the ball in the air, so they'll throw a fastball up for you to get under it or get into it where it's just a deep fly ball, whereas in Columbus if you put it in the air pretty decently, it's probably going to carry, so they pitched me just below the knees. The park has everything to do with how the pitcher is going to attack you because if the ball's not carrying, why are you going to throw pitches down in the zone when the only chance they really have to beat you is a line drive or ground ball?
"I knew that, in parks where the ball carries out, I have to hug the fence a little more, but in parks where it's a dead zone and the ball doesn't go anywhere, I play in because I know the ball will hang up and I have a better chance of flagging stuff down. I just have to worry about not letting anything drop in."
Extra credit
Tip your cap to Bulls starter J.D. Martin, who went 16-4 with a 2.75 ERA, despite playing in one of the worst pitchers' parks in Triple-A. He gave up a lot of long balls (15), but his 5-to-1 strikeout-to-walk ratio (116-26) ensured that baserunners were kept to a minimum.
Several things could have contributed to Martin's solid overall numbers, including making five more starts on the road (16) than at home (11). But even though he went 10-2 away from home and avoided pitching at Durham Bulls Athletic Park more often than not, he was actually more efficient at home in terms of WHIP (1.10 at home, 1.28 on the road) and opponents' batting average (.248 at home, .280 on the road).
No need to panic
Don't read too much into the perceived power outage of Yankees No. 6 prospect Zoilo Almonte. The outfielder saw his numbers plummet from 2012, when he smacked 21 homers and plated 70 runs, but that can be explained by the stronger Triple-A competition and the fact that the RailRiders' home park is difficult to go deep in.
Almonte actually improved his average by 20 points and added 47 points to his OBP by drawing more walks in fewer games. Trenton is another notoriously difficult place to hit in, so his power is very real. Combine that with increased plate discipline (5.6 percent walk rate at Double-A vs. 10.2 percent in Triple-A) and better command of the zone (4.1 K:BB ratio vs. 1.6 K:BB ratio) and it's easy to see why his star is still on the rise.
Pacific Coast League: At a Glance
| Stadium | Team | R | HR | H |
|---|---|---|---|---|
| Isotopes Park | Albuquerque Isotopes | 1.452 | 1.521 | 1.250 |
| Aces Ballpark | Reno Aces | 1.306 | 1.172 | 1.166 |
| Security Service Field | Colorado Springs Sky Sox | 1.244 | 1.068 | 1.149 |
| Cashman Field | Las Vegas 51s | 1.168 | 1.196 | 1.094 |
| Kino Veterans Memorial Stadium (2011-13) | Tucson Padres | 1.139 | 0.983 | 1.094 |
| Spring Mobile Ballpark | Salt Lake Bees | 1.128 | 0.995 | 1.067 |
| Chickasaw Bricktown Ballpark | Oklahoma City RedHawks | 1.006 | 0.796 | 1.025 |
| Dell Diamond | Round Rock Express | 0.990 | 1.068 | 1.001 |
| Werner Park (2011-13) | Omaha Storm Chasers | 0.985 | 1.214 | 0.986 |
| Herschel Greer Stadium | Nashville Sounds | 0.952 | 0.981 | 0.957 |
| Rosenblatt Stadium (2010) | Omaha Royals | 0.937 | 0.936 | 0.981 |
| Chukchansi Park | Fresno Grizzlies | 0.915 | 1.093 | 0.955 |
| Principal Park | Iowa Cubs | 0.862 | 0.845 | 0.914 |
| AutoZone Park | Memphis Redbirds | 0.850 | 0.904 | 0.905 |
| Cheney Stadium | Tacoma Rainiers | 0.771 | 0.994 | 0.845 |
| Raley Field | Sacramento River Cats | 0.758 | 0.715 | 0.835 |
| Zephyr Field | New Orleans Zephyrs | 0.751 | 0.859 | 0.876 |
| PGE Park (2010) | Portland Beavers | 0.694 | 0.678 | 0.797 |
The Pacific Coast League remains one of the best hitting environments in pro ball. Only the California League can rival the PCL's 5.1 runs per game among full-season circuits, fueled by a .431 slugging percentage, 2.5 percent home run rate and nine percent walk rate.
Isotopes Park, Aces Ballpark, Security Service Field and Cashman Field all rank above league average in hits, runs and homers, while half of the other 12 stadia are above average in at least one of the three categories.
New home, new environment
It will be interesting to see how the El Paso Chihuahuas' new ballpark plays. Tucson's Kino Veterans Memorial Stadium was neutral over the past three seasons. Before that, Portland's PGE Park (home to the now-defunct Beavers) was a strong pitchers' park. In 2010, the Beavers' last season in Portland, there were a league-low 103 homers hit there, exactly half of the PCL-leading 206 hit in Albuquerque.
Four of the Padres' top prospects -- pitchers Casey Kelly (No. 3) and Matt Wisler (5) and hitters Austin Hedges (2) and Rymer Liriano (4) -- could see time with the new Triple-A affiliate in 2014. And the new environment could play a big part in how we perceive this quartet -- especially Kelly and Liriano, who are returning from season-long injuries.
Lead by example
Take a look at the PCL's home run leaders last year. All five players with 20 or more homers -- Memphis' Brock Peterson (25) and Jamie Romak (22), Nashville's Hunter Morris (24), Iowa's Brad Nelson (20) and Fresno's Johnny Monell (20) -- played their home games in parks considered neutral or pitcher-friendly.
Morris, a former fourth-round pick, has been on the radar of many Brewers' fans for several years. The 25-year-old hit .303 with 28 homers and 113 RBIs as the Topps Southern League Player of the Year in 2012 and smacked 20 homers, including 19 in the pitcher-friendly Florida State League, in 2011.
With the exception of Monell, all the other 20-homer hitters played in the PCL's American Northern Division, home to the most neutral ballparks in the offense-heavy league.
Elevate this
Elevation -- along with dry air -- is one of the biggest factors affecting offensive numbers in the PCL. Albuquerque sits more than 5,100 feet above sea level, Reno at around 4,500 feet, Colorado Springs at more than 6,500 feet and Las Vegas at roughly 2,000 feet. To combat this thin, dry air, two teams have installed humidors in a bid to stop baseballs from drying out, thus leveling the playing field.
The Sky Sox installed theirs in 2012 and the Isotopes followed suit in 2013. In the two years since the humidor was installed at Security Service Field, there have been 220 homers. In the two years immediately before it was installed, there were 319, making the park appear almost neutral compared with league averages over that four-year span.
Isotopes Park may show similar results in coming years. The park averaged 198 homers between 2010-12. Last year, its first with the humidor, saw only 142 balls leave the park. That's a 31 percent drop in Colorado Springs and a 28 percent decline in Albuquerque.
Ashley Marshall is a contributor to MLB.com. Follow him on Twitter @AshMarshallMLB.