
X-Factors: Double-A ballpark effects
In X-Factors, MiLB.com's Ashley Marshall offers a class-by-class examination of how Minor League venues affect the play on the field. Have something to say about how your favorite Minor League park plays? Tweet @MiLB and @AshMarshallMLB with your thoughts.
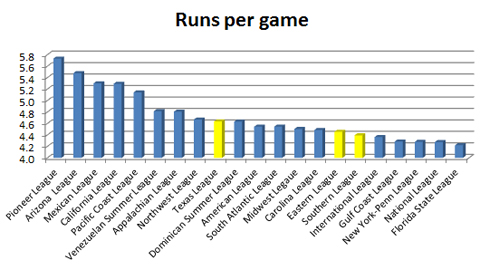
When it comes to level playing fields, few classifications provide the equality of Double-A.
Since 2008, there have been a similar number of runs per game in the Eastern, Southern and Texas leagues. Even more telling, the way these runs have been scored is almost identical, too. League-wide batting averages, on-base percentages and fielding rates are all close to one another and though there have been slightly more homers in the Southern League, both the Eastern and Texas leagues have a marginal edge in walk rates.
Because of this parity, it makes it much easier to compare, for example, pitchers on Binghamton and Arkansas or hitters plying their trades in Montgomery and Tulsa.
That doesn't mean there aren't extremes within each of three leagues, however, and that's why context is important when comparing players and predicting future performance.
Offensive stats by league, 2008-2013
| League | Class | R/G | AVG | OBP | SLG | OPS | HR% | BB% | FLD% |
|---|---|---|---|---|---|---|---|---|---|
| American | Majors | 4.5 | .260 | .327 | .413 | .740 | 2.7 | 8.3 | .984 |
| National | Majors | 4.3 | .255 | .323 | .400 | .723 | 2.4 | 8.4 | .984 |
| International | Triple-A | 4.4 | .260 | .329 | .397 | .726 | 2.1 | 8.6 | .979 |
| Mexican | Triple-A | 5.3 | .295 | .365 | .435 | .800 | 2.3 | 9.0 | .977 |
| Pacific Coast | Triple-A | 5.1 | .277 | .347 | .431 | .778 | 2.5 | 9.0 | .978 |
| Eastern | Double-A | 4.5 | .259 | .332 | .393 | .725 | 2.0 | 8.8 | .976 |
| Southern | Double-A | 4.4 | .257 | .334 | .385 | .719 | 1.8 | 9.4 | .975 |
| Texas | Double-A | 4.6 | .262 | .334 | .396 | .730 | 2.1 | 8.7 | .975 |
| California | Class A Adv | 5.3 | .272 | .342 | .422 | .764 | 2.3 | 8.6 | .971 |
| Carolina | Class A Adv | 4.5 | .256 | .329 | .386 | .714 | 1.8 | 8.6 | .972 |
| Florida State | Class A Adv | 4.2 | .256 | .326 | .372 | .698 | 1.5 | 8.4 | .973 |
| Midwest | Class A | 4.5 | .254 | .327 | .376 | .703 | 1.6 | 8.7 | .969 |
| South Atlantic | Class A | 4.5 | .256 | .326 | .378 | .704 | 1.6 | 8.3 | .968 |
| New York-Penn | Short Season | 4.3 | .247 | .322 | .353 | .674 | 1.2 | 8.6 | .966 |
| Northwest | Short Season | 4.7 | .253 | .334 | .364 | .699 | 1.4 | 9.3 | .967 |
| Appalachian | Rookie | 4.8 | .256 | .328 | .384 | .712 | 1.7 | 8.2 | .962 |
| Arizona | Rookie | 5.5 | .264 | .341 | .381 | .721 | 1.1 | 9.1 | .955 |
| Gulf Coast | Rookie | 4.3 | .245 | .323 | .345 | .668 | 1.0 | 8.6 | .962 |
| Pioneer | Rookie | 5.7 | .276 | .349 | .421 | .770 | 2.0 | 8.7 | .961 |
| Dominican Summer | Rookie | 4.6 | .238 | .336 | .322 | .658 | 0.7 | 10.7 | .952 |
| Venezuelan Summer | Rookie | 4.8 | .262 | .343 | .366 | .709 | 1.2 | 8.9 | .955 |
Here's an in-depth look at the park factors for each of the Double-A stadia since 2010. Where a club has relocated or changed leagues, multiple parks were listed. The table looked at three counting stats -- runs, home runs and hits -- and used a formula to help compare one park from another.
((Runs scored at home + runs allowed at home)/(Home games)) / ((Runs scored on the road + runs allowed on the road)/(Road games))
View the entire 2013 park factors list, alphabetized by team »
Note: A park factor of 1.000 is considered neutral and represented an equal number of runs/homers/hits at home as on the road. A factor over 1.000 favors hitters, while a factor under 1.000 favors pitchers. A weighted average was added into the calculation to place a greater emphasis on more recent data to be more reflective of the most current makeup of each team and league and to ensure the statistics were not disproportionately skewed by extremes.
Southern League: At a Glance
| Stadium | Team | R | HR | H |
|---|---|---|---|---|
| Smokies Park | Tennessee Smokies | 1.123 | 1.222 | 1.054 |
| Joe W. Davis Stadium | Huntsville Stars | 1.106 | 1.315 | 1.011 |
| Generals Park (2011-13) (Formerly Pringles Park) | Jackson Generals (2011-13), West Tenn Diamond Jaxx (2010) | 1.087 | 1.068 | 1.041 |
| Regions Field (2013) | Birmingham Barons (2013) | 1.085 | 0.827 | 1.018 |
| AT&T Field | Chattanooga Lookouts | 1.060 | 0.918 | 1.035 |
| Pensacola Bayfront Stadium (2012-13) | Pensacola Blue Wahoos (2012-13) | 1.009 | 1.380 | 1.016 |
| Baseball Grounds of Jacksonville | Jacksonville Suns | 0.985 | 1.018 | 0.965 |
| Montgomery Riverwalk Stadium | Montgomery Biscuits | 0.982 | 1.193 | 1.020 |
| Five County Stadium (2010-11) | Carolina Mudcats (2010-11) | 0.975 | 1.003 | 1.005 |
| Hank Aaron Stadium | Mobile Bay Bears | 0.954 | 1.015 | 0.996 |
| Trustmark Park | Mississippi Braves | 0.856 | 0.642 | 0.941 |
| Regions Park (2010-12) | Birmingham Barons (2010-12) | 0.835 | 0.513 | 0.910 |
Homers are plentiful in the Southern League, as long as you don't play your games in Birmingham's old Regions Park or Mississippi's Trustmark Park. The long ball prevalence has never been more true than in Smokies Park, a stadium that has the league's highest park factor for runs, homers and hits since 2010.
Only two full-season leagues have a higher runs per game rate than the Southern League's 4.4. The league also boasts the highest walk rate (9.4 percent) among all U.S.-based leagues.
No Smokies without Kyle
Cubs prospect Kyle Hendricks had the unfortunate task of pitching half of his games inside Smokies Park, but he still posted a stellar 10-3 record and league-best 1.85 ERA.
"I didn't find it too hard, to be honest," Hendricks said of taming Tennessee's hitter-friendly yard. "I pitched really well at home all year. Maybe it was a comfort thing. I've heard stories about the Cal League and how they have some real bandboxes there, but I felt all of the Southern League ballparks played pretty fair."
Hendricks has worked on one particular weapon during his three years in the Minors that might explain why he is unfazed.
"The biggest thing if you're pitching in a small park, the one thing you can dictate is keeping the ball out of the air," he said. "If you can get a two-seam fastball going and keep it down and on the ground that's the biggest asset you can have. I'm definitely a ground-ball pitcher. I shoot for early outs and early ground balls and early contact to keep the pitch count down and keep my fielders on [their] toes.
"If you just try to get them to hit it up the middle of the field, you'll be all right. You stay away from a guy, and if he's a good hitter he will hit it to center field or right field, if he's a right-handed hitter. If you pitch him in, he'll pull it. Maybe it's because I'm a ground-ball pitcher, so I didn't notice it as much."
The mid- and postseason All-Star posted a 0.68 ERA in 10 home starts in the most hitter-friendly ballpark in the league. He allowed five earned runs over 66 innings, held opponents to a .190 average and did not surrender a homer.
So why does Tennessee have a reputation as a hitters' park?
"It gets humid, so you think it would knock the ball down, but right down the lines to left field and right field it's very short," Hendricks said. "Fly-ball pitchers definitely have trouble there because it is so small down the lines.
"You have to establish the fastball inside, but when it comes down to crucial points of the game you try to make a guy beat you to the opposite field. You're not going to give them a cookie and let them pull it, especially at Smokies Park, where you can get it out down the line even if you're not a power hitter."
No explaining the power
Huntsville's home yard produces an above-average number of runs and a relatively neutral number of hits (at 405 feet to center field and 345 feet to left field, it is the league's largest park), but there have been one-third more homers in Stars home games than on the road over the past two seasons.
On one hand, three Stars (Hector Gomez , .196; Brock Kjeldgaard, .222; and Mike Walker , .223) finished among the bottom five among Southern League hitters who accumulated enough at-bats to qualify for the batting crown last year. On the other, Kjeldgaard led the league with 24 homers and Jason Rogers had 22 with a league-leading 87 RBIs.
Of the 34 Minor Leaguers who hit at least 24 homers, just one (Brandon Waring, 82) had fewer hits than Kjeldgaard's 99. But it's too simplistic to say the ballpark is entirely responsible for home run totals. Kjeldgaard has hit at least 12 homers in each of his six pro seasons (including three 20-homer campaigns) and Rogers actually hit 15 of his 22 long balls on the road in 2013.
So even though the park appears to play small to most hitters, maybe it's just a matter of the right hitter being there at the right time.
"I would say it's middle of the road, maybe slightly a hitters' park," said Kjeldgaard, who said the lack of a batters' eye in Huntsville can sometimes make it tough to see the ball. "It all depends on the day -- some days the wind is blowing in, some days it's blowing out -- you never really know.
"You can hit balls there that you think are home runs and they get knocked down by the wind. Other days, you don't think you squared it up and it carries. You just have to test it out during batting practice. As an outfielder, if the wind is blowing out, you will play a little deeper and if it's blowing in, you can play in a little bit more because you know you can get to more balls."
Eastern League: At a Glance
| Stadium | Team | R | HR | H |
|---|---|---|---|---|
| Hadlock Field | Portland Sea Dogs | 1.116 | 1.130 | 1.060 |
| Northeast Delta Dental Stadium | New Hampshire Fisher Cats | 1.068 | 1.058 | 1.025 |
| Jerry Uht Park | Erie SeaWolves | 1.060 | 1.444 | 1.024 |
| Metro Bank Park | Harrisburg Senators | 1.047 | 1.137 | 1.028 |
| FirstEnergy Stadium | Reading Fightin Phils | 1.037 | 1.482 | 0.977 |
| Prince George's Stadium | Bowie Baysox | 0.996 | 1.111 | 0.976 |
| The Diamond | Richmond Flying Squirrels | 0.979 | 0.866 | 0.979 |
| NYSEG Stadium | Binghamton Mets | 0.973 | 1.042 | 0.958 |
| Canal Park | Akron Aeros | 0.963 | 0.712 | 0.994 |
| New Britain Stadium | New Britain Rock Cats | 0.959 | 0.769 | 0.995 |
| Peoples Natural Gas Field | Altoona Curve | 0.943 | 0.725 | 1.020 |
| ARM & HAMMER Park | Trenton Thunder | 0.902 | 0.742 | 0.975 |
While The Diamond and Metro Bank Park have played fairly neutral over the past four years, there are radical extremes at either end of the spectrum. New Hampshire's Northeast Delta Dental Stadium is one of the Minors' best home run parks. In contrast, New Britain Stadium and Bowie's Prince George's Stadium are where balls go to die.
Leading off
Considering that Bowie is a pitchers' park, it might not come as a surprise that Mike Wright posted a 3.26 ERA -- tied for the best mark in the league -- while going 11-3.
But give credit to the Baysox offense, too. Cleanup man Caleb Joseph batted .299 with 22 homers and 97 RBIs, which ranked fifth, fourth and second, respectively, in the Eastern League. Brandon Waring tied for the top spot with 23 long balls out of the middle of the order and Kyle Hudson ranked eighth with a .292 average and fifth with a .386 OBP, primarily from the leadoff spot.
Power potential
Just how good was Reading's Jim Murphy in 2013? He mashed 23 homers, finished third on the circuit with 83 RBIs and second with 235 total bases. He hit 17 points higher at home (.282) with five more roundtrippers in one fewer game. But even if you prorate his stats from 70 road games, he still would have batted .265 with 18 homers and 80 RBIs, making him one of the league's top five power bats.
Texas League: At a Glance
| Stadium | Team | R | HR | H |
|---|---|---|---|---|
| Arvest Ballpark | Northwest Arkansas Naturals | 1.193 | 1.127 | 1.121 |
| Citibank Ballpark | Midland RockHounds | 1.092 | 0.702 | 1.136 |
| Whataburger Field | Corpus Christi Hooks | 1.067 | 1.156 | 1.032 |
| Hammons Field | Springfield Cardinals | 1.066 | 1.381 | 1.032 |
| ONEOK Field | Tulsa Drillers | 1.013 | 1.290 | 0.968 |
| Dr Pepper Ballpark | Frisco RoughRiders | 1.009 | 1.334 | 0.945 |
| Dickey-Stephens Park | Arkansas Travelers | 0.807 | 0.578 | 0.882 |
| Wolff Stadium | San Antonio Missions | 0.806 | 0.671 | 0.908 |
The Texas League provides a couple quirky statistics when it comes to examining park factors and offense.
Hammons Field and Dr Pepper Ballpark -- home to the Springfield Cardinals and Frisco RoughRiders -- rank as the top two places for home runs but fourth and sixth, respectively, for runs scored and hits. Midland's spacious Citibank Ballpark, on the other hand, ranks second for runs and hits but sixth in the eight-team league for homers.
What does that mean in terms of actual performance? The fact that it's 410 feet to straightaway center field in Midland could help explain why the RockHounds' Anthony Aliotti led the league with a .350 batting average and why his team batted .282 at home but .227 on the road. The short left field porch (315 feet) in Springfield also could shed light on why Cardinals right-handed slugger Xavier Scruggs was among the most productive -- and feared -- hitters in the league.
The X-Factor
Scruggs has posted healthy offensive numbers in Springfield's homer-happy Hammons Field the past two years. He hit 22 homers with 91 RBIs in 2012 and ranked second in the leaue with 29 homers to go with 81 RBIs last year.
"Playing in Springfield is just the top of the Texas League," Scruggs said. "The park is a really nice park, a great hitters' park. Being a position player, I just love hitting in there.
"The wind is usually very favorable to the hitters. It blows out to either left or to right, it doesn't blow straight in, so that always plays a factor. Even if it's not windy, the ball just carries well there. I don't know necessarily what it is because the dimensions are similar [400 feet to center field, 365 in left- and right-center field] to a lot of the other parks."
Scruggs has always shown a power stroke. He hit 21 dingers in each of the past two years, which included two long spells in the Florida State League, but he enjoys hitting in some Texas League parks much more than others.
"Frisco is a great hitters' park and the ball flies out of Corpus Christi, too," he said. "Some of the other parks, like Northwest Arkansas and Arkansas, play a little bit bigger and San Antonio's park eats up baseballs. It's almost like half are good hitters' parks and half are pitchers' parks.
"In San Antonio, the dimensions seem a little bit bigger in the gaps and there's a crosswind that blows in from left field to right field, so it's tougher for right-handed hitters to hit them out there. Little Rock [Arkansas] plays big because of the humidity and the ball just doesn't travel there. The ball just gets sucked up. They have big fences in their big gaps. Northwest Arkansas has very tall walls. They have their bullpens in right field and left field and almost like half a [Green] Monster that you have to hit it over, maybe a 15- or 18-foot wall. The fences in the rest of the park are pretty big, too."
The 26-year-old first baseman said the nature of his home park has had positive effects on other aspects of his game, particularly plate discipline and selectiveness; Scruggs and power-hitting teammate Ruben Gotay ranked first and second in the league in walks. Mike O'Neill was third, with Jake Lemmerman ninth and James Ramsey 12th.
"It definitely plays a big part," Scruggs said of the jet streams that help the ball carry in Springfield. "Pitchers would rather walk you and face another guy because they know a lot of times a good driven popup can go out of the stadium. I had a lot of walks and [Ruben] Gotay did as well. It definitely plays a big part of the pitching aspect of it because any guy that can drive the ball is able to get one out of Springfield, for sure."
Behind the numbers
Arkansas' Dickey-Stephens Park remains a tough place to hit.
In 2013, the Travelers batted a league-worst .244 at home. Only 15 of the other 119 full-season Minor League teams had a lower mark. The Travs also scored the second-fewest runs at home in the league (264), with only San Antonio plating fewer (252). On the flip side, Arkansas' pitching staff ranked second in opponents' batting average (.232), ERA (3.12) and runs allowed (233) in home games. Not surprisingly, San Antonio's pitching staff ranked first in all three categories.
Over the past four seasons, there have been 302 homers -- by the Travelers and their opponents -- at this park. That's the lowest mark in the Texas League, more than one-third fewer than the league average of 459. Some parks, like Hammons Field (629), have seen more than twice as many homers than Dickey-Stephens Field.
By contrast, there have been 542 homers in the games the Travelers have played on the road. That's the highest number in the Texas League between 2010-14 and the reason why the home run component of Arkansas' park factor is so small compared to the rest of the league.
Ashley Marshall is a contributor to MLB.com. Follow him on Twitter @AshMarshallMLB.