
X-Factors: A Advanced park effects
In X-Factors, MiLB.com's Ashley Marshall offers a class-by-class examination of how Minor League venues affect the play on the field. Have something to say about how your favorite Minor League park plays? Tweet @MiLB and @AshMarshallMLB with your thoughts.
The three Class A Advanced leagues essentially span the entire Minor League run-scoring environment.
At one end of the spectrum is the Florida State League, a 12-team circuit where run rates and homer totals are consistently among the lowest in any domestic full-season league. At the other end is the California League, a hitters' haven where balls fly out of the yard. And somewhere in the middle is the Carolina League, where slugging and on-base numbers are closest to the Minor League average.
Park factor statistics are league specific. So while it appears that teams like San Jose and Inland Empire play in extremely pitcher-friendly parks, they're only "extreme" in comparison to California League averages. In isolation, San Jose Municipal Stadium and San Manuel Stadium play small, but they look big compared with places like High Desert's Stater Bros. Stadium.
Similarly, there are few real launching pads in the Florida State League. Daytona's Jackie Robinson Ballpark seems like a terrible place to pitch when compared with the likes of Roger Dean Stadium, when it really isn't quite as easy to hit in as the isolated park factor data would suggest. That's why it's important to keep park factors within the context of the league.
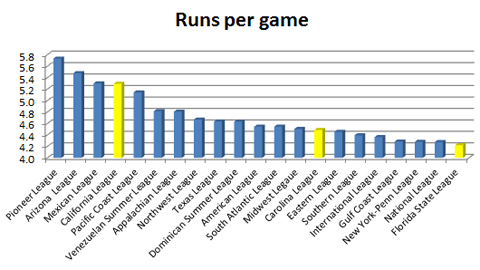
Offensive stats by league, 2008-2013
| League | Class | R/G | AVG | OBP | SLG | OPS | HR% | BB% | FLD% |
|---|---|---|---|---|---|---|---|---|---|
| American | Majors | 4.5 | .260 | .327 | .413 | .740 | 2.7 | 8.3 | .984 |
| National | Majors | 4.3 | .255 | .323 | .400 | .723 | 2.4 | 8.4 | .984 |
| International | Triple-A | 4.4 | .260 | .329 | .397 | .726 | 2.1 | 8.6 | .979 |
| Mexican | Triple-A | 5.3 | .295 | .365 | .435 | .800 | 2.3 | 9.0 | .977 |
| Pacific Coast | Triple-A | 5.1 | .277 | .347 | .431 | .778 | 2.5 | 9.0 | .978 |
| Eastern | Double-A | 4.5 | .259 | .332 | .393 | .725 | 2.0 | 8.8 | .976 |
| Southern | Double-A | 4.4 | .257 | .334 | .385 | .719 | 1.8 | 9.4 | .975 |
| Texas | Double-A | 4.6 | .262 | .334 | .396 | .730 | 2.1 | 8.7 | .975 |
| California | Class A Adv | 5.3 | .272 | .342 | .422 | .764 | 2.3 | 8.6 | .971 |
| Carolina | Class A Adv | 4.5 | .256 | .329 | .386 | .714 | 1.8 | 8.6 | .972 |
| Florida State | Class A Adv | 4.2 | .256 | .326 | .372 | .698 | 1.5 | 8.4 | .973 |
| Midwest | Class A | 4.5 | .254 | .327 | .376 | .703 | 1.6 | 8.7 | .969 |
| South Atlantic | Class A | 4.5 | .256 | .326 | .378 | .704 | 1.6 | 8.3 | .968 |
| New York-Penn | Short Season | 4.3 | .247 | .322 | .353 | .674 | 1.2 | 8.6 | .966 |
| Northwest | Short Season | 4.7 | .253 | .334 | .364 | .699 | 1.4 | 9.3 | .967 |
| Appalachian | Rookie | 4.8 | .256 | .328 | .384 | .712 | 1.7 | 8.2 | .962 |
| Arizona | Rookie | 5.5 | .264 | .341 | .381 | .721 | 1.1 | 9.1 | .955 |
| Gulf Coast | Rookie | 4.3 | .245 | .323 | .345 | .668 | 1.0 | 8.6 | .962 |
| Pioneer | Rookie | 5.7 | .276 | .349 | .421 | .770 | 2.0 | 8.7 | .961 |
| Dominican Summer | Rookie | 4.6 | .238 | .336 | .322 | .658 | 0.7 | 10.7 | .952 |
| Venezuelan Summer | Rookie | 4.8 | .262 | .343 | .366 | .709 | 1.2 | 8.9 | .955 |
((Runs scored at home + runs allowed at home)/(Home games)) / ((Runs scored on the road + runs allowed on the road)/(Road games))
View the entire 2013 park factors list, alphabetized by team »
Note: A park factor of 1.000 is considered neutral and represented an equal number of runs/homers/hits at home as on the road. A factor over 1.000 favors hitters, while a factor under 1.000 favors pitchers. A weighted average was added into the calculation to place a greater emphasis on more recent data to be more reflective of the most current makeup of each team and league and to ensure the statistics were not disproportionately skewed by extremes.
Florida State League: At a Glance
| Stadium | Team | R | HR | H |
|---|---|---|---|---|
| Tradition Field | St. Lucie Mets | 1.164 | 1.252 | 1.080 |
| McKechnie Field | Bradenton Marauders | 1.143 | 1.421 | 1.048 |
| Florida Auto Exchange Stadium | Dunedin Blue Jays | 1.113 | 1.305 | 1.022 |
| Bright House Field | Clearwater Threshers | 1.037 | 1.397 | 0.997 |
| Jackie Robinson Ballpark | Daytona Cubs | 1.022 | 1.213 | 0.985 |
| Charlotte Sports Park | Charlotte Stone Crabs | 1.004 | 1.180 | 0.989 |
| George M. Steinbrenner Field | Tampa Yankees | 1.000 | 0.721 | 1.031 |
| Joker Marchant Stadium | Lakeland Flying Tigers | 0.962 | 0.913 | 0.987 |
| Hammond Stadium | Fort Myers Miracle | 0.961 | 0.865 | 1.000 |
| Roger Dean Stadium | Jupiter Hammerheads | 0.926 | 0.615 | 0.998 |
| Roger Dean Stadium | Palm Beach Cardinals | 0.876 | 0.757 | 0.949 |
| Space Coast Stadium | Brevard County Manatees | 0.868 | 0.768 | 0.934 |
Generally speaking, the Florida State League is the place to pitch. No affiliated league has seen fewer runs per game (4.2) over the past six seasons and no full-season league has a lower home run rate (1.5 percent), slugging percentage (.372) or OPS (.698).
While teams like Daytona, St. Lucie and Bradenton play in some of the league's more hitter-friendly parks, facilities like Brevard County, Fort Myers and Jupiter/Palm Beach are much more reflective of the overall low-run environment.
Ryan coming up aces at Joker
After repeating the Midwest League in 2012, Kyle Ryan moved up to Lakeland in 2013 and had his most successful season since turning pro.
The 22-year-old left-hander tied for the league lead with 12 wins and ranked fourth in ERA (3.17), WHIP (1.19) and batting average against (.248).
"They say it's a pitchers' league, but it's also a league you have to mature in," Ryan said. "You have to learn to do things that you've never been able to do before, like pitch inside or throw one curveball in the zone then the next one out of the zone. That's the reason why it's a pitchers' league -- because you have to be smart.
"The weather conditions are a key component of the fields here, but each field is different."
Ryan went 3-2 with a 3.27 ERA in nine starts at Joker Marchant Stadium and 9-5 with a 3.11 mark in 15 contests on the road. Joker Marchant hosts the Tigers during Spring Training and, at 420 feet to center field, has similar dimensions to Detroit's Comerica Park. Ryan said playing his home games in a pitcher-friendly park gave him the confidence to challenge hitters in ways he hadn't before.
As someone who relies on pitching to contact, Ryan said he wasn't as hesitant to pitch inside or up at the letters. Even if he made a mistake with his location, there was still a chance the ball would stay in the yard.
"It's a huge advantage. I definitely was thinking of that before the season started," Ryan said. "I knew I'd be able to get away with some pitches. The atmosphere conditions are different here. The air is thinner in the north, but here it's more humid with thicker air. The ball flies more in the north.
"I have to have the defense behind me because I can't blow people away. I'm a high-80s, low-90s kind of guy with a changeup, a cutter and a curveball. I have to work with my defense and my defense has to work with me."
While the environment helped Ryan develop as a pitcher, there were still places he enjoyed pitching more than others. City Island, home to the Daytona Cubs, was a particularly hitter-friendly park. Located on the banks of the Halifax River and just one mile west of the Atlantic Ocean, fly balls carry as well there as any place in the league.
"The ball flies in Daytona," said Ryan, who yielded a two-run homer to Jorge Soler in his only start there. "It's on the coast and you have the wind that's constantly blowing out to left field, so if you have a righty hit even a pop fly it's going to go out.
"I pitched once or twice in Bradenton and left field is a bandbox, and I had some balls fly out of there. And the Blue Jays' place in Dunedin -- they have a short left-field fence, so if you can get the ball up, it's going to go. I've seen a few home runs go out to left field in St. Lucie even though it's a pretty big park and it's surrounded by trees. Brevard is a pitchers' park if you can get the ball up and in the air to left field. If a lefty hits one, pulls one to right field -- see ya, ball."
Two teams, one outcome
The Jupiter Hammerheads and Palm Beach Cardinals have shared Roger Dean Stadium since 2003. The Cardinals and Marlins play home games there each spring, and the park also hosts both organizations' Gulf Coast League affiliates.
Since 2010, the stadium has produced 426 total home runs in Florida State League games. Jupiter's 192 homers over that stretch are the fewest in the league, while Palm Beach is second-fewest with 234.
Jupiter and Palm Beach had the second- and third-lowest runs totals in the FSL, but the first- and fourth-best ERAs. Only Space Coast Stadium is considered a more pitcher-friendly park.
When you consider offensive numbers posted by Palm Beach's Jonathan Rodriguez (18 homers, .481 slugging percentage) in 2013 and Jupiter's Marcell Ozuna (24 homers, 95 RBIs) and Kyle Jensen (23 homers, .309 average) in 2012 and 2011, respectively, you get a new appreciation of how impressive their seasons were.
California League: At a Glance
| Stadium | Team | R | HR | H |
|---|---|---|---|---|
| Stater Bros. Stadium | High Desert Mavericks | 1.434 | 1.779 | 1.238 |
| The Hanger | Lancaster JetHawks | 1.306 | 1.441 | 1.151 |
| Recreation Ballpark | Visalia Rawhide | 1.071 | 1.215 | 1.011 |
| Sam Lynn Ballpark | Bakersfield Blaze | 1.058 | 1.288 | 1.033 |
| Banner Island Ballpark | Stockton Ports | 0.938 | 1.252 | 0.914 |
| John Thurman Field | Modesto Nuts | 0.895 | 0.518 | 0.944 |
| Rancho Cucamonga Epicenter | Rancho Cucamonga Quakes | 0.887 | 0.898 | 0.956 |
| Lake Elsinore Diamond | Lake Elsinore Storm | 0.866 | 0.594 | 0.939 |
| San Jose Municipal Stadium | San Jose Giants | 0.847 | 0.820 | 0.919 |
| San Manuel Stadium | Inland Empire 66ers | 0.799 | 0.542 | 0.921 |
The offensively charged Cal League offers a spike in runs, hits and homers and a corresponding rise in ERAs. It's generally good news for hitters and quite the opposite for hurlers, regardless of which park they play in.
If you're a ball hawk, head out to the area beyond the outfield wall at High Desert's Stater Bros. Stadium. Since 2010, there have been 843 home runs hit out of that park. That's the most in the Minors during that four-year span, and no team has seen a greater disparity between the number of homers hit in home and road (474) games. The difference of 369 (around 92 a season) is more than 100 greater than 140 of the other 141 domestic teams, from Triple-A to short-season.
Life in Lancaster
The Hanger is home to the Lancaster JetHawks and, as a hitter-friendly park in a hitter-friendly league, an outlier in the Astros system. Most of Houston's affiliates play their games in relatively neutral parks, but the ball flies in Lancaster, elevated more than 2,200 feet above sea level and set in a town where the average temperature is between 90-100 degrees over the final four months of the season.
"I think we consider every factor ... and obviously, the park plays a role in that," Astros director of pro scouting Kevin Goldstein said. "It doesn't need a really advanced understanding of analytics to know that a .290 batting average with 25 home runs means a very different thing for a player in Quad Cities than it does a player in Lancaster.
"We're still trying to look at the skills and separate the skills from the numbers, and you absolutely have to adjust for [leagues and environments]."
Four JetHawks hit above .300 this season. Matt Duffy (.323) ranked second in the league, Delino DeShields (.317) was third, M.P. Cokinos (.313) ranked fourth and Joe Sclafani (.302) placed seventh. Andrew Aplin was first overall with 107 RBIs and Nolan Fontana led the circuit with a .415 on-base percentage.
Though impressive offensive numbers are par for the course in the Cal League, Goldstein said pitchers stand to benefit the most from the environment.
"You look at guys like Luis Cruz and Brady Rogers, who pitched for us in Lancaster last year," he said. "You look at their stat lines and maybe think, 'That's not so good,' but if you consider where they were pitching and that their home games were in Lancaster and many of their road games were in some of the other high-octane environments in the south part of the California League, they had really good years.
"If a guy has the right mindset, it's a great place to learn how to pitch because there's no better place to learn that you have to keep the ball down in Lancaster. Every league has its strengths and weaknesses, and you just have to figure out what's the best thing you can learn here. In Lancaster, it's keeping the ball down. But it can also create some bad habits for guys -- hitters who maybe put a little too much loft in their swing and try to hunt for those cheap home runs. Next thing you know, they're in a more neutral park and all of a sudden they're all fly balls."
Cruz went 8-6 with a 5.16 ERA in 27 games, including 18 starts, but he struck out more than 10 batters per nine innings (129 in 113 1/3), had a 3-to-1 strikeout-to-walk ratio and held opponents to a career-best .253 average. Rodgers, meanwhile, went 10-8 but recorded a 5.38 ERA over 27 games (also 18 starts) as part of a piggybacking rotation. But Rodgers was actually 5-2 at home; on the road, he had a losing record (5-6), struck out fewer batters, allowed more homers and subsequently posted a 5.98 ERA.
"Numbers are important because it's how you measure production, but it's important to measure it in the right way," Goldstein said. "We make sure kids focus on baseball and not the stadium they're playing in and not trying to adjust their game to the stadium, because hopefully they won't be in that stadium forever. If they're doing the right thing, they'll keep moving up."
Relatively speaking
There were 78 homers hit in Inland Empire last year -- 36 by the host 66ers and 42 by their opponents over 70 games. Similarly, there were 88 long balls drilled out of Modesto's John Thurman Field -- 40 by the Nuts and 48 by their guests.
On the face of it, that appears pretty neutral. A little on the low side, maybe -- there were 98 homers at each full-season ballpark, on average in 2013 -- but certainly not outrageous. After all, 50 of the 120 full-season teams played their home games in ballparks that saw fewer than 88 homers. One-fourth (31) of the teams played in parks that yielded fewer than 78.
Then you put those numbers in the context of the California League, where the average was 132 homers per ballpark.
Players like the 66ers' Zach Borenstein (28 homers, 95 RBIs, .337 average) still put up big numbers because he played in a hitters' league, but remember he only hit seven long balls at home and had a slugging percentage 155 points higher on the road.
Carolina League: At a Glance
| Stadium | Team | R | HR | H |
|---|---|---|---|---|
| BB&T Ballpark | Winston-Salem Dash | 1.107 | 1.144 | 1.070 |
| G. Richards Pfitzner Stadium | Potomac Nationals | 1.042 | 1.041 | 1.027 |
| Five County Stadium (2012-13) | Carolina Mudcats | 1.035 | 1.036 | 1.055 |
| Harry Grove Stadium | Frederick Keys | 1.025 | 1.719 | 0.961 |
| TicketReturn.com Field | Myrtle Beach Pelicans | 1.019 | 0.931 | 1.010 |
| Salem Memorial Baseball Stadium | Salem Red Sox | 0.995 | 0.787 | 1.021 |
| Calvin Falwell Field | Lynchburg Hillcats | 0.985 | 0.965 | 1.032 |
| Grainger Stadium (2010-11) | Kinston Indians | 0.956 | 1.010 | 0.941 |
| Daniel S. Frawley Stadium | Wilmington Blue Rocks | 0.840 | 0.624 | 0.884 |
The Carolina League can be considered average among the three Class A Advanced circuits. The Cal League has higher run totals and homer rates, while the Florida State League offers similar batting averages but fewer runs.
Outside of Frederick, there are few extreme hitters' parks in the Carolina League. Since 2010, there have been a league-best 516 homers hit in Keys' home games, compared to a league-worst 307 long balls in their road games. Harry Grove Stadium saw the most homers of any park in the circuit in 2013, 2012 and 2010, and it ranked second behind Winston-Salem in 2011.
Wilmington's Frawley Stadium is the league's most pitcher-friendly park, despite not being excessively large -- it's 400 feet to center field and 325 down the lines.
A Dash in the pan?
Winston-Salem's BB&T Ballpark has been favorable to hitters for several years. In 2013, the ballpark saw 107 homers launched over its walls, more than every other locale in the league, except Frederick (125). It marked the third consecutive year that there were more than 100 homers hit at the Dash's home park.
The Dash led the league with 116 total homers, ranking first in total bases (1,890), doubles (281), runs scored (703) and RBIs (653).
Among the White Sox prospects to benefit the most was Carolina League MVP Chris Curley, who led the circuit with 24 homers, 92 RBIs and 251 total bases. How much of the production was real and how much was a reflection of the ballpark?
Curley hit 11 homers in 52 games across two levels in 2012 and three homers in 68 contests in 2010. He certainly was not considered a power-hitting prospect when the Braves signed him as a non-drafted free agent in 2009, and it was only once he got to Kannapolis that his power stroke began to materialize.
When you consider Curley's splits, a better picture emerges. In 68 home games, he batted .284 with 12 homers, 13 doubles and 50 RBIs. On the road, he hit .275 with 12 homers, 11 doubles and 42 RBIs, suggesting his production was more a result of underlying skills than taking advantage of a friendly home yard.
The complete pitcher picture?
The Potomac Nationals play in a slight hitters' park. Pfitzner Stadium has seen the third-most total homers in the league since 2013, so give credit to the entire P-Nats staff last season.
Potomac led the league with a collective 3.69 ERA en route to the best record in the circuit (84-55). It's not too often a team's pitching staff surrenders the most homers in the league (98) and still ranks first in ERA.
Blake Schwartz was one of the standouts on that team. He tied for first with 11 wins and ranked second in the league with a 2.65 ERA. His 1.08 WHIP was the best in the circuit, largely because of a league-best 1.76 walks per nine innings and .236 batting average against. So even though he allowed eight homers, runners were kept off base to minimize this damage.
Ashley Marshall is a contributor to MLB.com. Follow him on Twitter @AshMarshallMLB.