
X-Factors: Class A ballpark effects
In X-Factors, MiLB.com's Ashley Marshall offers a class-by-class examination of how Minor League venues affect the play on the field. Have something to say about how your favorite Minor League park plays? Tweet @MiLB and @AshMarshallMLB with your thoughts.
In contrast to the disparate "run environments" between, say, the Class A Advanced Florida State League and California League, or even the two Triple-A leagues, the similarities between the two Class A circuits make comparing players across the entire level relatively straightforward. In fact, runs per game and home run percentage have been identical in the Midwest and South Atlantic League over the past five years, while virtually every other offensive metric falls within a couple percentage points.
Offensive stats by league, 2008-2013
| League | Class | R/G | AVG | OBP | SLG | OPS | HR% | BB% | FLD% |
|---|---|---|---|---|---|---|---|---|---|
| American | Majors | 4.5 | .260 | .327 | .413 | .740 | 2.7 | 8.3 | .984 |
| National | Majors | 4.3 | .255 | .323 | .400 | .723 | 2.4 | 8.4 | .984 |
| International | Triple-A | 4.4 | .260 | .329 | .397 | .726 | 2.1 | 8.6 | .979 |
| Mexican | Triple-A | 5.3 | .295 | .365 | .435 | .800 | 2.3 | 9.0 | .977 |
| Pacific Coast | Triple-A | 5.1 | .277 | .347 | .431 | .778 | 2.5 | 9.0 | .978 |
| Eastern | Double-A | 4.5 | .259 | .332 | .393 | .725 | 2.0 | 8.8 | .976 |
| Southern | Double-A | 4.4 | .257 | .334 | .385 | .719 | 1.8 | 9.4 | .975 |
| Texas | Double-A | 4.6 | .262 | .334 | .396 | .730 | 2.1 | 8.7 | .975 |
| California | Class A Adv | 5.3 | .272 | .342 | .422 | .764 | 2.3 | 8.6 | .971 |
| Carolina | Class A Adv | 4.5 | .256 | .329 | .386 | .714 | 1.8 | 8.6 | .972 |
| Florida State | Class A Adv | 4.2 | .256 | .326 | .372 | .698 | 1.5 | 8.4 | .973 |
| Midwest | Class A | 4.5 | .254 | .327 | .376 | .703 | 1.6 | 8.7 | .969 |
| South Atlantic | Class A | 4.5 | .256 | .326 | .378 | .704 | 1.6 | 8.3 | .968 |
| New York-Penn | Short Season | 4.3 | .247 | .322 | .353 | .674 | 1.2 | 8.6 | .966 |
| Northwest | Short Season | 4.7 | .253 | .334 | .364 | .699 | 1.4 | 9.3 | .967 |
| Appalachian | Rookie | 4.8 | .256 | .328 | .384 | .712 | 1.7 | 8.2 | .962 |
| Arizona | Rookie | 5.5 | .264 | .341 | .381 | .721 | 1.1 | 9.1 | .955 |
| Gulf Coast | Rookie | 4.3 | .245 | .323 | .345 | .668 | 1.0 | 8.6 | .962 |
| Pioneer | Rookie | 5.7 | .276 | .349 | .421 | .770 | 2.0 | 8.7 | .961 |
| Dominican Summer | Rookie | 4.6 | .238 | .336 | .322 | .658 | 0.7 | 10.7 | .952 |
| Venezuelan Summer | Rookie | 4.8 | .262 | .343 | .366 | .709 | 1.2 | 8.9 | .955 |
Below is an in-depth look at the park factors for each Class A stadium since 2010. Where a club has relocated or changed leagues, two parks were listed. The table looks at three statistics -- runs, home runs and hits -- and uses a formula to help compare one park with another. For example:
((Runs scored at home + runs allowed at home)/(Home games)) / ((Runs scored on the road + runs allowed on the road)/(Road games))
View the entire 2013 park factors list, alphabetized by team »
Note: A park factor of 1.000 is considered neutral and represents an equal number of runs/homers/hits at home as on the road. A factor over 1.000 favors hitters, while a factor under 1.000 favors pitchers. A weighted average was added to the calculation to place a greater emphasis on more recent data to better reflect the most current makeup of each team and league and ensure the statistics were not disproportionately skewed by extremes.
Midwest League: At a Glance
| Stadium | Team | R | HR | H |
|---|---|---|---|---|
| Cooley Law School Stadium | Lansing Lugnuts | 1.117 | 0.936 | 1.058 |
| Veteran's Memorial Stadium | Cedar Rapids Kernels | 1.101 | 1.304 | 1.040 |
| Parkview Field | Fort Wayne Tincaps | 1.079 | 1.076 | 1.070 |
| Community Field | Burlington Bees | 1.068 | 1.221 | 1.003 |
| Time Warner Cable Field at Fox Cities Stadium | Wisconsin Timber Rattlers | 1.051 | 1.080 | 1.041 |
| Fifth Third Field | Dayton Dragons | 1.032 | 1.225 | 1.010 |
| Classic Park | Lake County Captains | 1.001 | 1.399 | 0.992 |
| Fifth Third Bank Ballpark | Kane County Cougars | 0.986 | 0.802 | 1.014 |
| Fifth Third Ballpark | West Michigan Whitecaps | 0.985 | 0.708 | 1.024 |
| Coveleski Stadium | South Bend Silver Hawks | 0.978 | 0.784 | 0.963 |
| Harry C. Pohlman Field | Beloit Snappers | 0.975 | 1.091 | 0.983 |
| Modern Woodmen Park | Quad Cities River Bandits | 0.963 | 0.911 | 0.963 |
| Ashford University Field | Clinton LumberKings | 0.950 | 0.802 | 0.970 |
| Dozer Park | Peoria Chiefs | 0.934 | 0.938 | 0.991 |
| Dow Diamond | Great Lakes Loons | 0.933 | 0.869 | 0.972 |
| Bowling Green Ballpark | Bowling Green Hot Rods | 0.905 | 1.136 | 0.925 |
The Midwest League is statistically the most level playing field in all of affiliated baseball.
One of the reasons is that there are 16 teams in the league, twice as many as the Carolina League, so teams play a smaller percentage of games in extreme parks. In 2013, the average number of homers hit in each park was 81 with a median value of 80 and a range -- the distance between the greatest and smallest number -- of 49. There were 110 homers hit in Cedar Rapids and 61 in West Michigan, but those were the two extreme outliers.
To put this in perspective, the average in the South Atlantic League was 78, but the range was 133.
In the Midwest League last season, Dayton's Fifth Third Field and Cedar Rapids' Perfect Game Field were arguably the most hitter-friendly. Kane County's Fifth Third Bank Ballpark and South Bend's Coveleski Stadium favored pitchers, while Beloit's Harry C. Pohlman Field was relatively neutral, despite seeing a lot of offense.
A Kernel of truth
Twins third-round pick Adam Brett Walker had no problems making the jump from the Appalachian League to Cedar Rapids in 2013. The 6-foot-4, 225-pound outfielder led the Midwest League with 27 homers and 109 RBIs, but he said the Kernels' hitter-friendly home yard didn't inflate his overall numbers too much.
"I definitely enjoyed playing there. I thought it was a pretty unique park with the short porch down the left-field line and the high fence, and I thought that added a different aspect to the game," he said. "It's nothing like Fenway, but there were a couple balls that hit the top of the fence, so I always thought that was interesting. Center field usually played pretty big and some guys with speed could turn doubles into triples, but overall, I thought it was a decent park to hit in.
"I try not to pull the ball because it's not always the best thing to just yank the ball down the line, but I did try to drive it out to left-center. Balls got out a lot quicker to left field and you could tell it was a little shorter. The wind usually blows to left or left-center, but sometimes it would also change and blow to right field. You can definitely change a ballgame playing there."
The quirky dimensions, varying fence heights and swirling winds make home runs something of a lottery, depending on which part of the park you target and when.
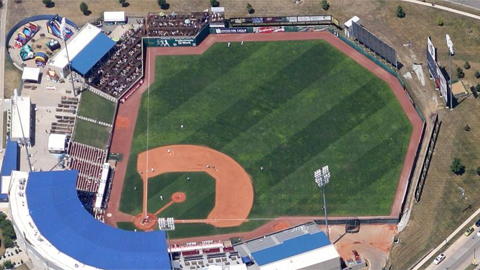
It's only 315 feet down the line in left, but a 15-foot fence in front of the elevated bleachers keeps some balls in play. The field then cuts back out to 378 feet in left-center, where the fence drops to 8 feet tall, and evens out at 400 feet to straightaway center. The right-center field gap is 390 feet from home plate, with the right field foul pole measured at 325 feet.
"[The outfield wall] kind of shot back, then in straightaway center it shot back," Walker said. "It was kinda funky. We had a guy hit an inside-the-parker when the left fielder went back and just missed it, and it hit the wall at the wrong angle and took off to center field."
As for the league's other ballparks, Walker has mixed reviews.
"I played in Dayton in the All-Star Game and the wind was blowing in hard from left field, so right-handed hitters didn't have that much fun hitting during BP," he said. "It seemed like a fairly big ballpark. But when we went to Lake County, the ball flies there. It was definitely a hitter-friendly ballpark. I know we had a bunch of home runs as a team and I had two there. Both teams put up some runs. It didn't seem that short, but the wind blew out the whole series and the ball flew out. And from what I heard, it was like that the whole time. I wouldn't mind playing all of my games there.
"It didn't feel like I played much better at home or much better on the road. I thought I played fairly consistently throughout the year and it didn't seem like I hit all of my home runs at home or all on the road," Walker added. "I think most of them that I hit at home, they should have been home runs. I can't really think of any that I didn't really get a hold of."
Walker was not the only one who enjoyed targeting the short left-field porch at Perfect Game Field. A in the Cedar Rapids Gazette feature on on Byron Buxton last April said that each of MLB.com's top prospect's first three homers at Veterans Memorial Stadium not only cleared the left-field fence but actually hit a house across the street, some 120 feet beyond the ballpark.
Fit for a (Lumber)King
Ashford University Field may be a slight pitchers' park, but that didn't keep Clinton's coaching staff from preaching to pound the lower half of the strike zone. The reason? To establish good habits as they move through the system.
"The high fly balls that Victor [Sanchez] gave up that were caught on the track every once in a while, those will be home runs in High Desert," said Andrew Lorraine, who served as LumberKings pitching coach from 2012-13 and will move up to the California League this year. "Victor was not a true ground-ball pitcher last year. When he was really on and was down, he sunk the ball and got a lot of ground balls, but there were also games when he got a lot of fly-ball outs. That will put more pressure on him to get the ball down.
"The same with Tyler Pike -- he wasn't a ground-ball pitcher. It's going to be interesting to see him pitch to pitch and game to game, because mistakes in High Desert are magnified. [Scott] DeCecco was basically a fly-ball pitcher. He went to the California League the last month and a half and did really well and didn't have that problem. Maybe he focused better and kept the ball down," added Lorraine, who also noted that Clinton pitchers Charles Kaalekahi and Rigoberto Garcia are also fly-ball pitchers who will face a challenge in transitioning to High Desert.
Lorraine indicated that league-wide factors such as weather -- games were canceled for cold temperatures, rain, snow, lightning and wet grounds in 2013 -- can have as much of an impact as park-specific trends.
"The Midwest League, where I was the past two years, if you throw your fastball where you want it and if you have something else you can get over the plate, you can have success there," Lorraine said. "You'll have days where the ball flies out of places like Burlington, where the wind blows straight out, but most of the parks are pretty fair. You don't have too many, 'What happened?' moments.
"Clinton doesn't have a huge ballpark, but it plays pretty big most of the year. Most of the parks are pretty pitcher-friendly earlier in the year because nobody likes to hit in cold weather. There's never a great place to hit or a great place to pitch always."
South Atlantic League: At a Glance
| Stadium | Team | R | HR | H |
|---|---|---|---|---|
| McCormick Field | Asheville Tourists | 1.376 | 1.642 | 1.205 |
| L.P. Frans Stadium | Hickory Crawdads | 1.142 | 1.443 | 1.088 |
| State Mutual Stadium | Rome Braves | 1.074 | 0.719 | 1.048 |
| Appalachian Power Park | West Virginia Power | 1.069 | 1.085 | 1.010 |
| Fluor Field at the West End | Greenville Drive | 1.039 | 1.199 | 1.040 |
| CMC-NorthEast Stadium | Kannapolis Intimidators | 1.035 | 0.851 | 1.003 |
| Municipal Stadium | Hagerstown Suns | 1.002 | 1.088 | 1.006 |
| NewBridge Bank Park | Greensboro Grasshoppers | 0.952 | 1.649 | 1.101 |
| Arthur W. Perdue Stadium | Delmarva Shorebirds | 0.919 | 0.718 | 0.964 |
| Lake Olmstead Stadium | Augusta GreenJackets | 0.861 | 0.542 | 0.939 |
| Joseph P. Riley, Jr. Park | Charleston RiverDogs | 0.847 | 0.785 | 0.910 |
| FirstEnergy Park | Lakewood BlueClaws | 0.819 | 0.496 | 0.910 |
| Grayson Stadium | Savannah Sand Gnats | 0.795 | 0.503 | 0.876 |
| Whitaker Bank Ballpark | Lexington Legends | 0.648 | 0.826 | 0.656 |
While the Midwest League is a balanced circuit with few extremes, the South Atlantic League has been feast or famine.
Take Greensboro, for example. Since 2010, there have been 593 homers in games the Grasshoppers played at home, but only 299 in their road games. High Desert was the only Minor League team with a greater disparity (369).
The Grasshoppers hit 75 homers in their own yard and 33 on the road. The pitching staff yielded 86 dingers at home and 36 away from NewBridge Bank Park.
At the other end of the spectrum are teams like Lakewood (discussed below) and Savannah. There have been more than twice as many long balls in Sand Gnats' games (352) on the road than at home (172), explaining a home run park factor around .500 in comparison to the rest of the league.
Who's your Crawdaddy?
Joey Gallo, Ryan Rua and Lewis Brinson made Hickory's L.P. Frans Stadium look tiny in 2013.
Hickory's 178 homers toppled Macon's previous South Atlantic League single-season record of 173, set in 1998. Although the Crawdads hit 100 homers at home, they also cracked 78 on their travels, more than Lakewood (49), Savannah (50), Hagerstown (56), Delmarva (57), Lexington (59), Greenville (60), Rome (60), Kannapolis (62) and Augusta (67) hit in total.
"It's a little bit of a copout to say it's just the ballpark. Maybe it plays into it a little bit, but not as much as people like to think," Hickory manager Corey Ragsdale told MiLB.com in January. "The wind blows in, maybe because it sits down at the bottom of a big hill.
"But if you ever go to the Sally League, you'll see there are parks that are much more hitter-friendly. But there are also parks that are much less hitter-friendly, and we still hit them out of there, too. I think it was just a crazy collection of talent, with Joey and Ryan and Lewis."
Power outage?
Lakewood hit a league-worst 49 homers last year (15 at home), so don't look at the lack of power numbers and assume players in the middle of the lineup simply had bad years.
BlueClaws first baseman Art Charles went deep 11 times and plated 72 runs -- both team highs. He recorded 24 homers over two years of Rookie-level and short-season ball between 2011-12, so the raw power is there. You can make the argument that had he played in a more neutral environment in 2013, he would have been closer to 20 dingers than 10.
Charles batted a career-best .251 and collected 34 doubles, but he was handcuffed by his inconsistent home/road splits. He hit .274 with two homers in spacious FirstEnergy Park and .231 with nine homers on the road. If he can put it all together -- a consistent line drive stroke with a slight uppercut on pitches down in the zone -- he can find success. But temper expectations for 2014, considering Charles might move to the pitcher-friendly Florida State League, where long balls go to die.
Imitating Fenway
Greenville's Fluor Field at the West End is built with an eye to the future. The Class A affiliate of the Red Sox essentially has made its own version of Fenway Park in South Carolina.
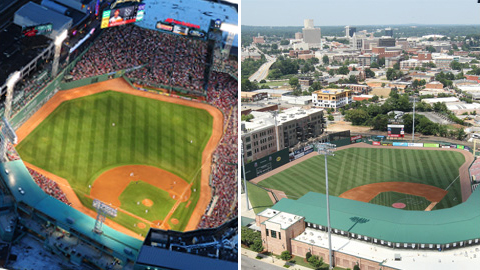
Like Fenway, Fluor Field is also 310 feet to left field with its own 33-foot wall (the Green Monster is 37 feet tall). It's also 379 feet to left-center, 390 feet to center and 420 feet to deep center, where it mimics the Triangle. It's 380 feet to deep right and 302 feet to the right-field porch, a version of the Pesky Pole, where the field curves away.
Keeping everything off-the-field the same, Fluor Field also has a manual scoreboard and a PA system that plays "Sweet Caroline" during the eighth inning.
Ashley Marshall is a contributor to MiLB.com. Follow him on Twitter @AshMarshallMLB.